
A practical guide to data observability, tracing delays, and choosing what needs attention.
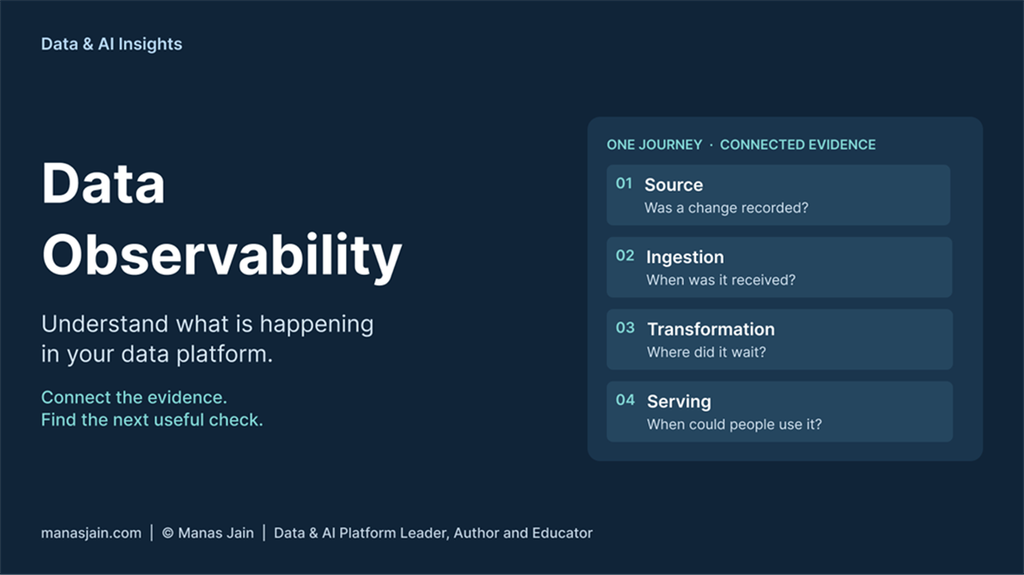
Data observability connects evidence across a data journey so teams can decide what to investigate next.
At 14:16, store staff are still seeing old inventory information. The source application recorded a change several minutes ago, and the ingestion process has received it. Yet the team cannot explain where the update is waiting. Data observability should help them answer that question without assembling the story from five unrelated screens.
This is an illustrative retailer scenario. All identifiers, timestamps, and operating targets in this article are synthetic. The immediate consequence is practical: staff need to know whether the inventory view can support their next decision or whether they should use an agreed fallback.
An individual job status offers only part of the answer. It describes one execution, perhaps against an earlier input or a different processing window. Understanding the journey requires evidence that connects the source change, the processing that handles it, and the output a person actually sees.
What does data observability help you understand?
Data observability is the ability to use evidence from data flows and their surrounding systems to understand behavior and investigate unexpected problems. For the retailer, that means establishing how far an inventory update traveled, where it waited, and which consumer was affected. A dashboard can present that evidence, but the dashboard itself is not the capability.
Monitoring often starts with a known condition: has a run failed, or has a delay crossed a threshold? Observability supports the investigation that follows, including questions the team did not anticipate when setting up those checks. These capabilities overlap. A useful alert, a recorded run state, and an investigation view can all contribute to the same response.
Data quality asks whether data is fit for its intended use. Observability contributes evidence about what the platform and its data are doing over time. A failed quality assessment may be one useful observation, but a recent timestamp alone proves neither correctness nor completeness. The data quality guide explores fitness for use in more detail.
The OpenTelemetry observability primer explains the general systems foundation. A data-platform investigation also needs context, such as the dataset, processing window, output version, and consumer. Infrastructure signals cannot supply all of that meaning by themselves.
Start with the question each signal should answer.
Before choosing what to collect, write the questions an engineer would ask. Did the source produce a relevant change? Has ingestion received it? Has processing started? Is the result available in the store inventory view? These questions give each observation a purpose.
The retailer needs several kinds of evidence. Each answers a different part of the investigation, and none explains the entire incident alone.
| Investigation question | Useful evidence |
| What ran and what happened | Run history showing start, finish, state, and attempt number. |
| Where did time pass? | Matched source, receipt, processing, and publication timestamps. |
| What did a stage report | Timestamped diagnostic records, usually called logs, with a run reference and useful outcome or error category. |
| What changed around this period? | Deployment, configuration, schedule, and dependency-change records. |
| Which input and output were involved? | Dataset or partition identifiers, observed activity, and output versions are included. |
| What else does this work depend on? | A dependency map showing relevant upstream inputs and downstream consumers. |
A metric is a numerical measurement over time, such as waiting work or processing duration. A log records a particular event. A trace connects related operations along a journey. These forms of telemetry, meaning evidence emitted by a system, become more useful when they refer to the same work. A data pipeline may also need explicit job and dataset records that an application trace does not capture.
Recent changes deserve attention because they suggest checks, not because proximity proves causation. A deployment shortly before the delay is a candidate explanation. Evidence must still show how that change could have produced the observed behavior.
Connect evidence across the data journey.
The retailer has five relevant stages: source application, ingestion, transformation, serving store, and inventory view. Transformation reshapes the data; the serving store holds the output that the view reads. Each stage should expose evidence about its part of the journey.
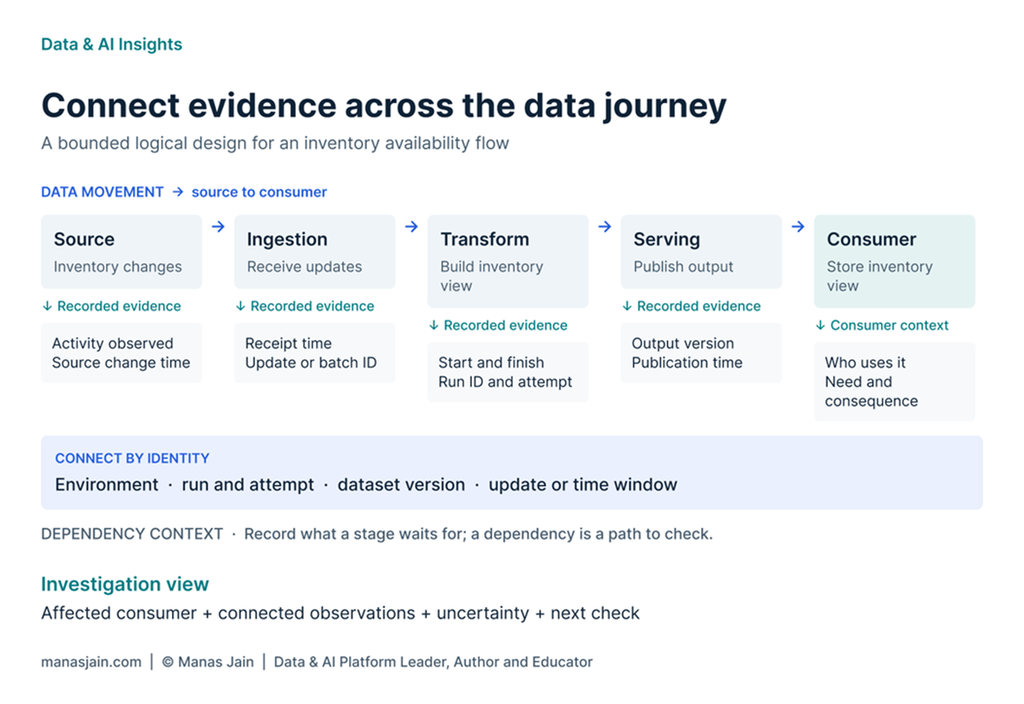
Data moves from source to consumer. Stage observations connect through run, dataset, and update identities; dependency context helps guide the next check.
The diagram separates data movement from evidence collection. The update passes through the processing stages, while observations from those stages enter the investigation view. Dependency information tells the investigator where to look next. Those connections describe relationships; they do not establish the cause of a delay.
Assign every processing run an identity and distinguish its attempts. A retry is a separate execution attempt; combining their timings can produce a misleading history. Record the environment too, so test evidence does not accidentally join a production investigation.
Connect the run to its actual input and output. A batch might use a partition and processing window; an individual change might use a safe update reference. When work splits or combines, record those relationships explicitly rather than assuming one identifier survives every transformation.
For the example, transformation run R-214 links ingestion batch B-214 to inventory output version V-214, with update U-482 included in that batch. A serving record indicates when V-214 became available in the view. This makes the comparison inspectable rather than relying on nearby timestamps.
The OpenLineage object model provides one useful way to consider jobs, their runs, and the datasets they read or write. Adopting a particular tool is optional here. Establishing which execution and data the evidence describes is essential.
An investigation view could initially be a saved query and a small run table. At greater scale, it may combine orchestration records, metrics, logs, and dependency information. The design test is whether an engineer can move from the affected output to relevant evidence without guessing which records belong together.
Work through the inventory investigation
Follow one illustrative inventory update, U-482, through transformation run R-214, attempt 1. For this example, clocks are aligned, the timestamps refer to the same update, and serving time means the updated value is available to the inventory view.
| Observation | Synthetic time |
| Source records update U-482. | 14:10:00 |
| Ingestion receives the update. | 14:10:04 |
| The Transformation run R-214 attempt 1 has started. | 14:16:40 |
| Transformation finishes. | 14:17:00 |
| The updated value is now available in the inventory view. | 14:17:08 |
The journey takes seven minutes and eight seconds. Four seconds pass before receipt, six minutes and thirty-six seconds between receipt and the start of transformation, twenty seconds during transformation, and eight seconds before the updated view is available. The largest observed interval is the wait before transformation.
This analysis locates the wait without establishing why it occurred. The transformation might have been awaiting its scheduled slot, an upstream prerequisite, or available execution capacity. The timestamps alone cannot choose between those explanations.
The next useful check is the scheduler and dependency history for transformation run R-214, attempt 1, during that interval. Is the run eligible to start? Was it explicitly waiting on another run? Was work queued? A recorded waiting state would strengthen one explanation; an absent record leaves a gap. None of these questions requires an immediate speculative rerun.
Keep the investigation record explicit. Known: this update reached ingestion and then waited before transformation. Unknown: What produced that wait? Next evidence: eligibility, queue, and prerequisite records for the matching run. This small distinction prevents a plausible story from becoming an unsupported root-cause statement.
The example follows one update, not every update in the period. It also describes the inventory view becoming current for that value, not a completeness check across all inventory. If the source had shown no activity, the team would first need to establish whether it expected changes before declaring it stalled.
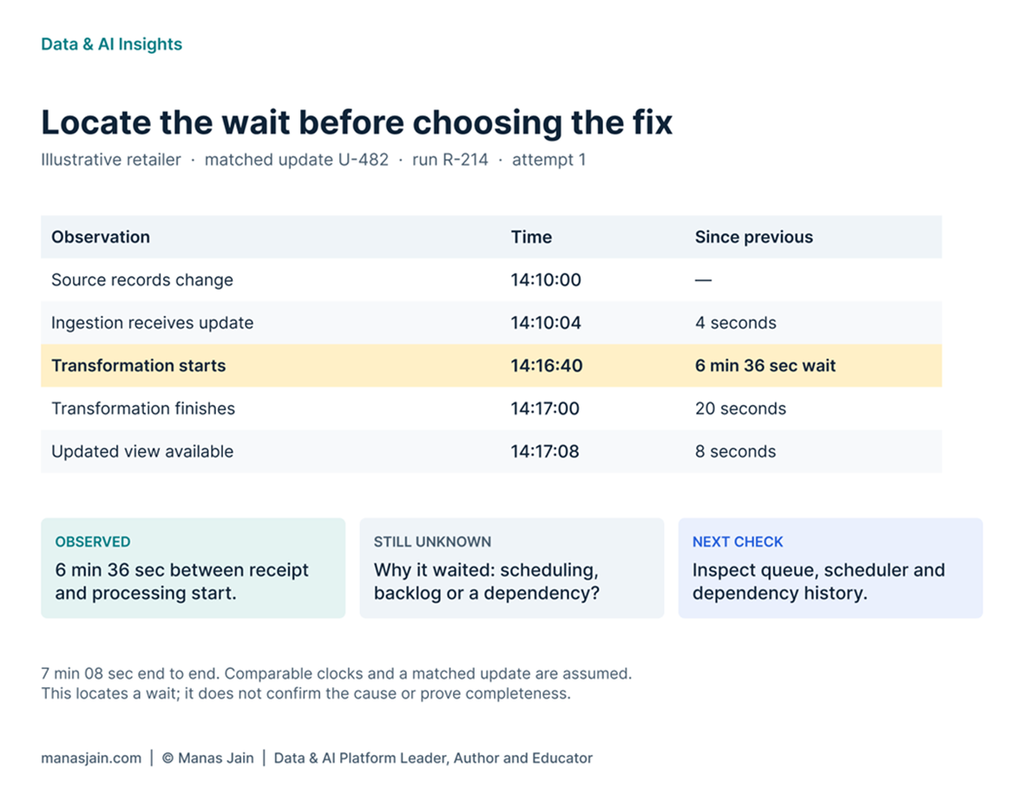
The illustrative update waited 6 minutes 36 seconds before transformation. The evidence locates the wait but does not confirm its cause.
Use consumer impact to choose the response
A measured delay does not determine urgency on its own. Store staff might need the view immediately to make a stock decision, while a planning report might have hours before use. Their deadline, available fallback, and consequence of waiting change the appropriate response.
For this illustrative inventory flow, assume an agreed target of availability within two minutes while stores are operating. The observed seven-minute journey breaches that example target. The response should follow the operating agreement: identify who can investigate and whether staff should use a fallback while evidence is gathered.
An immediate page makes sense only when the situation warrants interruption and someone can take useful action. Other deviations may become an owned work item or a recorded observation. Google SRE monitoring guidance is useful background on connecting monitoring to service concerns and operational responses; it does not prescribe one threshold for every data consumer.
Where the evidence can mislead you
Missing telemetry is not proof that nothing happened. Collection can fail even while data processing continues, and an empty investigation view may reflect a broken collector. Record when evidence was last received and make collection health visible alongside processing health.
Timestamps also need a defined meaning. Source-change time, receipt time, run-start time, and publication time describe different events. Unsynchronized clocks can distort intervals, and a recent publication timestamp may refer to an older input. Matching identities and checking clock assumptions matter as much as displaying more precision.
Dependency information can be stale. A newly added input, an undocumented file, or an application cache can break the apparent path between a completed run and what a user sees. Treat the map as evidence to verify during an investigation, especially when the observed behavior contradicts it.
Choose evidence you can justify.
There is a cost to detail. Recording every event at full granularity can increase collection, storage, and query costs; reducing detail can remove the clue needed later. Choose the resolution and retention that support the questions for this flow, including how long investigators may need to look back.
At a smaller scale, a few structured run records may be enough. At a larger scale, retaining a detailed trace of every update may be impractical. Choose the level of evidence deliberately: a run-level record can locate a delayed batch, while an individual-update question may require more specific instrumentation. Be clear about which questions the chosen approach can answer.
Diagnostic records can also contain information that should not be there. Useful context usually means run references, stage, time, and outcome; it does not automatically justify storing customer payloads or access tokens. OpenTelemetry guidance on sensitive data explains this collection risk. Review what instrumentation emits and who can read it.
An AI assistant can help summarize verified observations or suggest the next check. It still needs the same reliable identities, access boundaries, and distinction between fact and hypothesis. Adding an assistant does not repair missing evidence.
A minimum useful observability plan
The following Minimum Useful Observability Plan is an original planning template, not an industry standard. This completed example captures the investigation design for the retailer. Its targets and response choices are assumptions to replace with the team’s actual agreements.
| Field | Completed inventory example |
| Important data flow | Source inventory changes → ingestion → transformation → serving store → store inventory view. |
| Consumer and consequence | Store staff use the view for stock decisions. A delay may require an agreed fallback before acting on it. |
| Question to answer | Did U-482 wait before transformation, and what run condition explains that wait? |
| Evidence needed | Matched boundary timestamps; run state and attempt; scheduler eligibility; queue and dependency history; input and output references; relevant recent changes. |
| How evidence connects | Update U-482; transformation run R-214 attempt 1; input batch B-214 and output version V-214; production environment; the 14:10–14:18 investigation window; recorded dependencies. |
| Expectation or baseline | Assumed availability within two minutes while stores operate. Check expected source activity separately. |
| First diagnostic step | Inspect eligibility, queue, and prerequisite records for transformation run R-214 attempt 1 during the observed six-minute, thirty-six-second wait. |
| Response and responsible team | The data-platform operations team investigates. They escalate under the agreed store-impact procedure when active decisions are affected and route non-urgent findings for follow-up. |
| Evidence handling | Retain useful timing, identity, state, and error-category records under a reviewed retention policy. Restrict access and omit unnecessary payloads and secrets. |
| Verification exercise | Give another engineer the synthetic evidence. Ask them to identify the affected flow, known waiting interval, uncertainty, and next check. Record missing evidence. |
Test the plan on one flow.
Start with one important flow and run that verification exercise. Give a colleague the recorded evidence without narrating the answer, then ask them to reconstruct what happened. If they cannot connect a run to its output, identify that specific gap before adding another dashboard.
The practical goal is a defensible account of the journey: what happened, where the evidence stops, who is affected, and which check will establish the next fact. That is what makes data observability useful during the next incident.