
A practical guide to detecting, understanding, and preventing data quality problems in modern data platforms
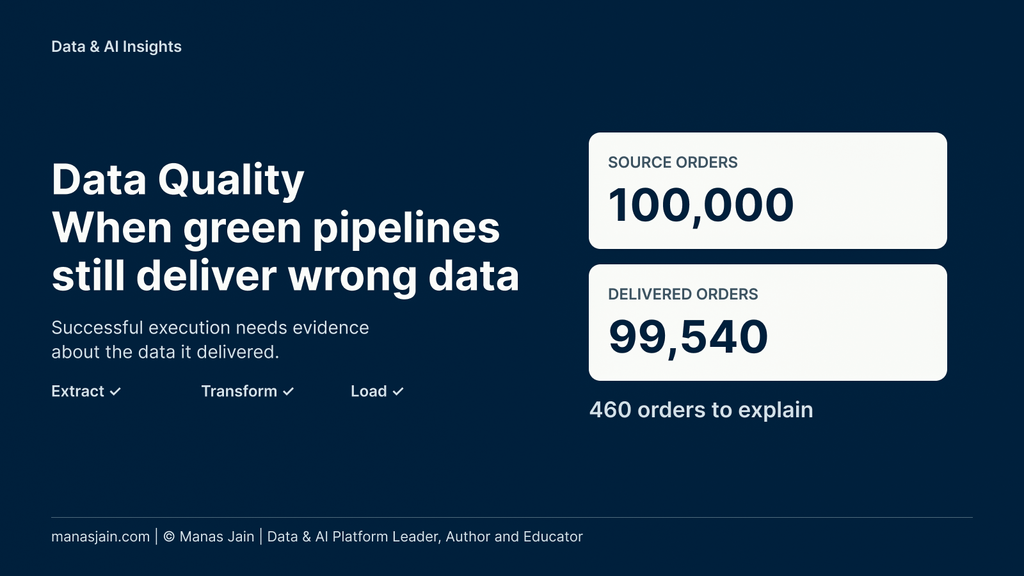
A data quality problem can hide inside a successful pipeline. Imagine an overnight order feed: every job is green, the dashboard refreshes on time, and nobody receives an alert. Then someone compares the records. The source contains 100,000 orders, but only 99,540 have reached the target.
Those 460 orders raise questions the job status cannot answer. Were they deliberately excluded? Did validation reject them? Will they arrive later? Or did a transformation quietly remove them?
The same problem can appear without a missing record. A customer identifier may be present but refer to the wrong customer. An amount may be numeric but use a different currency. A report may refresh every morning while continuing to display yesterday’s business data.
A successful pipeline tells us that the process completed under its configured rules. Trust requires evidence about what the process delivered and whether people can use it safely.
A useful way to approach that evidence is Detect → Understand → Diagnose → Own → Prevent. The sequence connects technical checks with business expectations and gives teams somewhere practical to start.
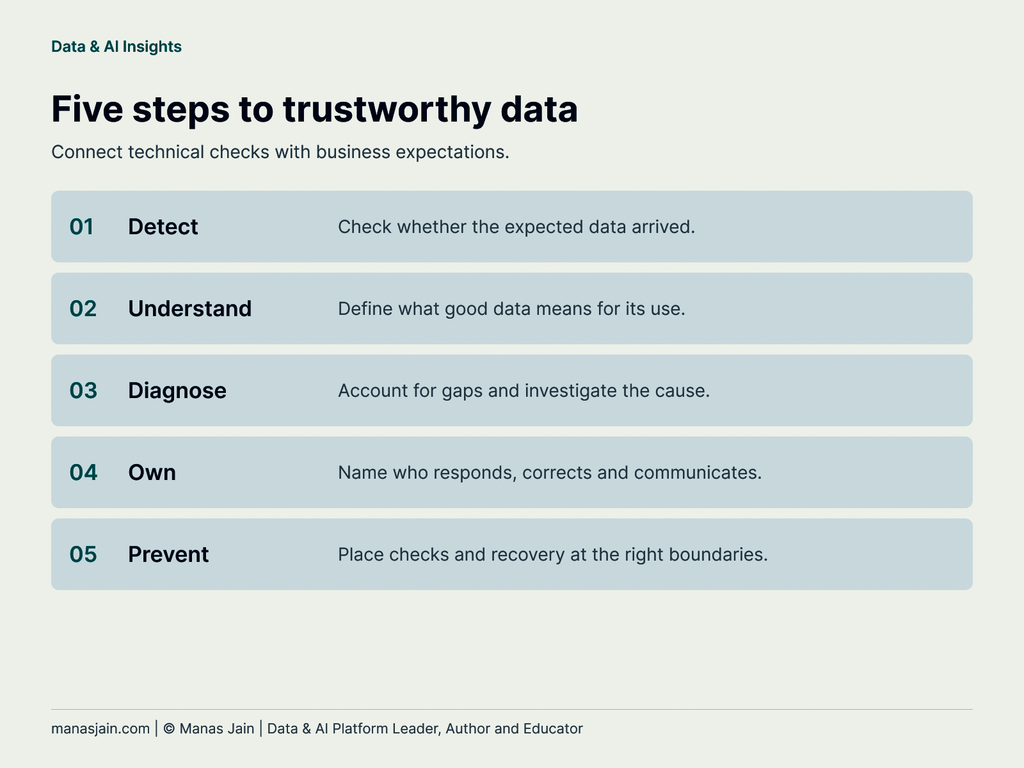
01 Detect data quality problems beyond job status
Consider a pipeline that reads a file, converts several fields, and writes a table. Its error handling allows invalid records to move into a rejection file. The job completed successfully because it handled those records exactly as designed.
That behavior may be appropriate. The problem starts when the dashboard presents the result as complete and the rejected records disappear from the conversation.
Technical monitoring answers questions such as whether the job ran, whether a connection failed, and how long processing took. Data checks ask whether the expected records arrived, critical fields contain useful values, and business calculations still make sense.
These checks operate at different levels. A field check might verify that every order has an identifier. A dataset check might look for repeated identifiers. A business check might compare the total value of eligible orders with the total delivered downstream.
For a critical order feed, I would want the delivery result to show accepted, rejected, and deliberately excluded records alongside the job status. Each number should use an agreed scope and processing window. Otherwise, “successful” leaves too much room for interpretation.
Even that set of checks has limits. Every configured rule could pass while an untested business assumption remains wrong. Quality checks provide evidence against defined expectations; they cannot prove that every possible defect is absent.
02 Understand what good data quality means.
Data quality is about fitness for the intended use. A dataset can be useful for one decision and unsuitable for another.
Suppose a customer dataset has reliable identifiers and country information but incomplete street addresses. It may support a regional sales report. It may be unsuitable for sending invoices or arranging deliveries.
This is why “the dataset is 98% complete” needs more explanation. Which fields are missing? Which records are affected? What will consumers do with them?
The UK Government Data Quality Framework provides a useful starting point through six common dimensions:
| Dimension | Plain English question | Order data example |
| Completeness | Is the expected information present? | Every eligible order arrives with its required fields. |
| Uniqueness | Is each entity represented as intended? | The same order does not appear twice in a table with one row per order. |
| Consistency | Do related representations agree? | An order has the same status in systems where the definitions and timing should match. |
| Timeliness | Is the information available when needed? | Today’s eligible orders reach the operational report before its cutoff. |
| Validity | Does the value meet the defined rules? | The currency code belongs to the accepted list. |
| Accuracy | Does the value reflect reality? | The recorded amount matches the actual order. |
Validity and accuracy are especially easy to confuse. A date can follow the required format and still be the wrong date. A customer identifier can pass a pattern check and still identify the wrong person. Checking accuracy often needs a trusted reference or confirmation from the business process.
The next step is to turn these dimensions into specific expectations. “Orders should be complete” is difficult to operate. “Every eligible order created before midnight must reach the report by 6 a.m., with an order identifier and currency” gives engineers and consumers something they can check together.
Different uses may need different tolerances. An exploratory trend report might tolerate a small delay that would be unacceptable in a fulfillment process. Those choices should be explicit, especially when the same dataset supports several consumers.
03 Diagnose the gap with reconciliation
Return to the 100,000 source orders and 99,540 target orders. The difference is a signal. We still need to establish what it means.
The comparison must use compatible populations. Are both sides counting unique orders, or is one counting order lines? Do they cover the same business period? Are they using the same cancellation rules? Has the target had enough time to meet its delivery commitment?
Comparing a live source with an older target snapshot can create an apparent gap simply because the source has changed. Save the comparison window and cutoff so someone else can reproduce the result.
This process is called reconciliation: comparing expected and actual results, then accounting for differences.
Here is an illustrative breakdown. The categories are mutually exclusive, and the counts refer to the same defined population. Quarantine means keeping records that fail validation in a separate holding area for investigation.
| Outcome | Orders |
| Delivered by the report cutoff | 99,540 |
| Excluded under agreed business rules | 280 |
| Held in quarantine after validation failed | 120 |
| Delivered after the report cutoff | 40 |
| Still unexplained | 20 |
| Total source orders | 100,000 |
The raw source-to-target difference is 460. After the 280 agreed exclusions, we expect 99,720 eligible orders. Only 99,540 arrived by the cutoff, leaving an eligible delivery shortfall of 180. Those 180 need different responses: 120 require investigation and recovery from quarantine, 40 arrived late, and 20 remain unexplained.
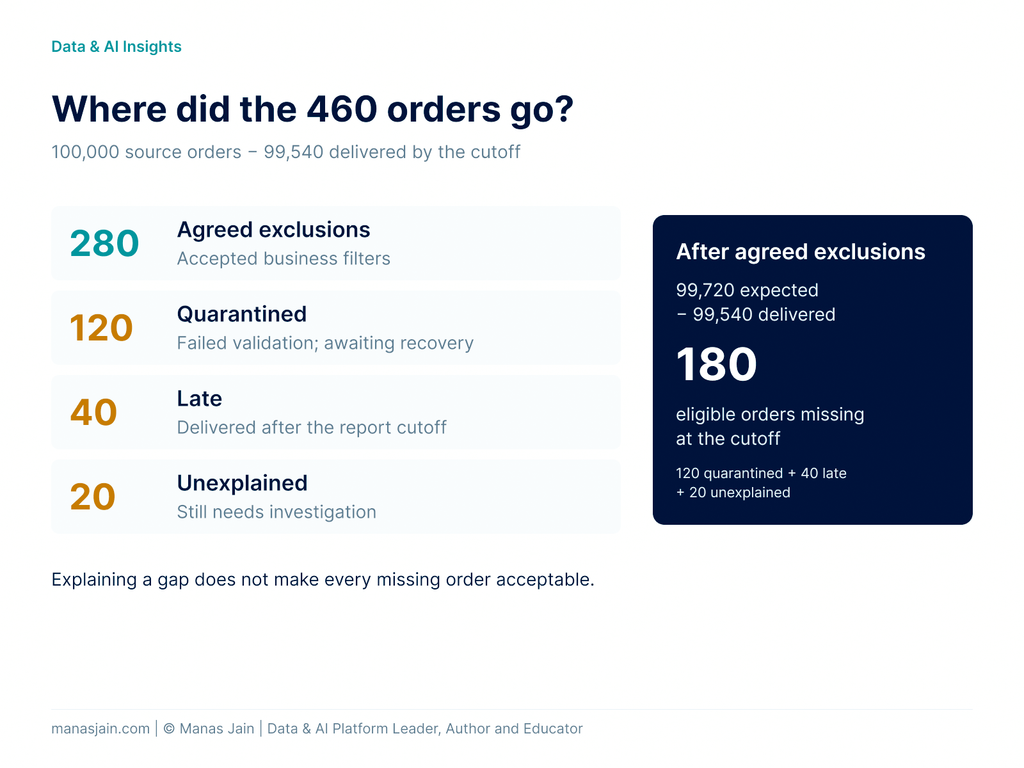
Accounting for the gap does not automatically make the outcome acceptable. A consumer expecting all eligible orders by the cutoff is still missing data, even when the team knows where it went.
Counts are only the starting point. Two datasets can both contain 100,000 records while containing different orders. Missing orders and duplicates can cancel each other out numerically.
Compare identifiers as well as totals. Where values matter, check relevant amounts, currencies, and business attributes. At a larger scale, split the comparison by date, region, or another useful boundary so investigations remain affordable.
Finally, separate symptoms from causes. A missing customer name is a symptom. An upstream field rename that stopped a mapping from populating the name is a cause. Fixing the empty values once will leave the failure mechanism in place.
04 Take ownership of the response and the correction.
A quality alert needs a route to resolution. Otherwise, it can become a message that several teams see and nobody acts on.
Consider an order status changing from “COMPLETE” to “FULFILLED.” The producer regards this as a legitimate business change. The platform loads the value successfully. A downstream report recognizes only the old value and classifies the orders incorrectly.
Resolving the incident requires several kinds of knowledge. The producer understands what the status means. The platform team can inspect transport and transformation behavior. The consumer can explain how the report uses the status and which decisions are affected.
Shared participation should still leave a named person or team coordinating the response. The appropriate lead depends on the cause and the organization’s operating model.
A useful quality rule records its purpose, owner, threshold, affected consumers, and the action taken on failure. The description should also say who can decide that the rule needs to change. Otherwise, an engineer may loosen a threshold to clear an alert without resolving the underlying business concern.
During an incident, communicate the practical limitation. “The job passed” tells a consumer very little. “The report excludes 120 orders awaiting validation; fulfillment figures are incomplete” helps them decide whether to use it.
Once the cause is fixed, check the recovery too. Correcting the mapping does not necessarily repair yesterday’s output. Teams may need to replay or reprocess affected records, refresh reports, and confirm that consumers now receive the intended result.
05 Prevent problems at the right boundaries
Quality checks are useful wherever a failure can first be detected reliably. Some belong close to data entry. Others require information that becomes available during ingestion, transformation, or consumption.
A source application can require an order identifier. Ingestion can reject an unreadable file or detect a missing batch. Transformation can check that a join has not unexpectedly removed orders. A final publication check can confirm that business totals and delivery deadlines meet consumer expectations.
Repeating every check at every stage adds cost and noise. Choose checks according to what each boundary can know and the impact of allowing bad data to move further.
The action on failure matters as much as the rule:
| Response | When it can help | Trade-off |
| Block publication | A failure makes the output unsafe for its intended use. | Fresh output is delayed; consumers may need an older version. |
| Quarantine records | Suspect records can be isolated while useful records continue. | Consumers receive a partial dataset and must understand that limitation. |
| Warn and continue. | The issue is tolerable for the specific use and needs attention. | The problem can persist if nobody responds. |
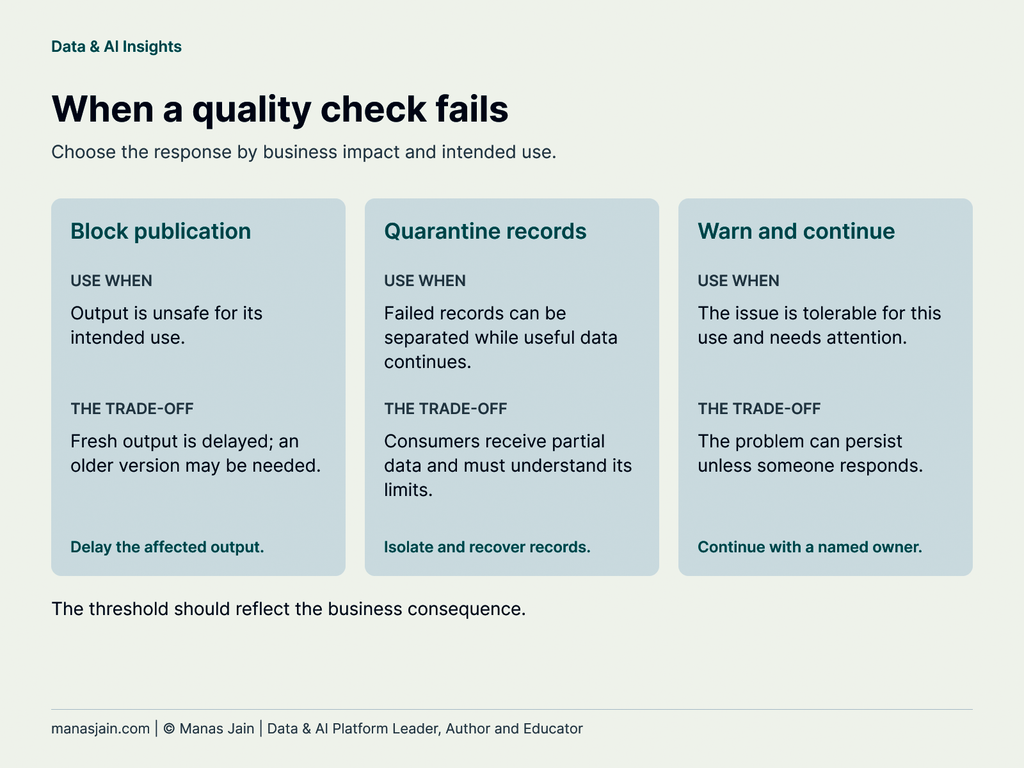
There is no universal threshold for these choices. An optional description field and a payment amount deserve different treatment. A threshold should reflect the business consequence, rather than the value that makes the dashboard green.
Producer and consumer expectations also need to cover change. If an allowed status, field meaning, or delivery window changes, dependent checks may need review. Data contracts can make those expectations explicit, including meaning, quality, ownership, and change rules. The agreement becomes useful when teams connect it to checks and actions.
Where similar controls recur across pipelines, shared templates or libraries can help teams apply them consistently. I explore that architecture question in Stop Building Pipelines. Start Building Data Capabilities.
Prevention also includes recovery. Keep sufficient evidence to identify affected records, correct them, and rerun checks. A pipeline that detects bad data but cannot recover it leaves the organization with a different operational problem.
How data quality and observability fit together
Data quality asks whether data meets the expectations of its intended use. Data observability helps teams understand how data and systems behave over time, making unexpected changes easier to investigate.
For example, a quality rule may find that required order identifiers are missing. Observability may show when the missing-value rate changed and which upstream change happened around that time.
The capabilities support each other. Broader visibility can improve diagnosis, while explicit quality expectations explain which changes matter to consumers. A deeper treatment of observability deserves its own discussion.
Where AI can help with diagnosis
A rule can report that rejected orders increased. The harder question is why.
One useful role for AI assistance is to examine permitted evidence such as failed samples, rule results, job logs, and recent mapping changes. It could propose explanations, connect related clues, and suggest the next investigation step.
That proposal needs verification. If the suspected cause is a changed status value, the team should inspect the source values and transformation logic. A convincing explanation alone is insufficient evidence.
Start with assistance that reduces investigation effort. Provide it relevant, authorized context and require a clear distinction between observed facts and hypotheses. Changes to production data or quality thresholds should follow the team’s established controls.
A practical starting point for better data quality
You do not need a large program to begin. Choose one important dataset and one consequential use. Then work through five questions:
- What must the consumer be able to trust? Identify the records, fields, and delivery commitments that matter.
- What evidence checks those expectations? Include business outcomes alongside technical validation.
- Can we explain the differences? Reconcile comparable populations and preserve rejected-record evidence.
- Who responds when a check fails? Name the response lead and the people needed for correction.
- How will we prevent and recover from recurrence? Address the cause, repair affected outputs, and verify the result.
Start with a few useful rules. Review them when business processes, source systems, or consumer needs change. Remove checks that no longer add value and improve those that repeatedly produce noise.
A green pipeline is a useful operational signal. Trustworthy delivery requires a fuller explanation: what arrived, what changed, what was excluded, what failed, and whether the result meets its intended use. That is the standard I would build towards: every important dataset should arrive with enough evidence for its consumers to know what they can trust.